Maximize Your Sales: Discover the Best Reporting Tools for Commercial Teams
What are the top reporting tools used by successful commercial sales teams?
Are you aiming to shoot your sales performance into the stratosphere? 🚀 Understanding the myriad of reports available to your commercial team can be as bewildering as decoding the Enigma machine without Alan Turing’s help! But fret not, this article will demystify the best reporting tools that are essential for transforming your sales data into a clear-cut action plan for out-of-this-world results.
Unlock Insights with Cutting-Edge Reporting Tools
As the digital universe expands, so does the complexity of sales data. Having the right tools to navigate this cosmos is crucial for any commercial team aiming to succeed.
1. Specks of Data or Constellations of Insights?
The difference between mediocre and exceptional sales strategies often lies in the interpretation of data. Are you merely looking at numbers, or are you connecting the dots to reveal the big picture? Reporting tools can illuminate patterns that would otherwise remain hidden in the dark matter of raw data.
2. Shine a Light on Hidden Opportunities
With sophisticated analytics, Salesforce Reports and Power BI can pinpoint trends that reveal untapped markets and customer segments thirsty for your offerings. Like astronomers discovering a new planet, these tools help discover profitable niches you didn’t know existed.
3. Forecast Accuracy that Would Make Nostradamus Jealous
Forget crystal balls; modern reporting tools use AI to predict future sales with astonishing accuracy. Platforms like Zoho Analytics transform your historical data into reliable forecasts, enabling you to plan with confidence.
Reports Tailor-Made for Decision Makers
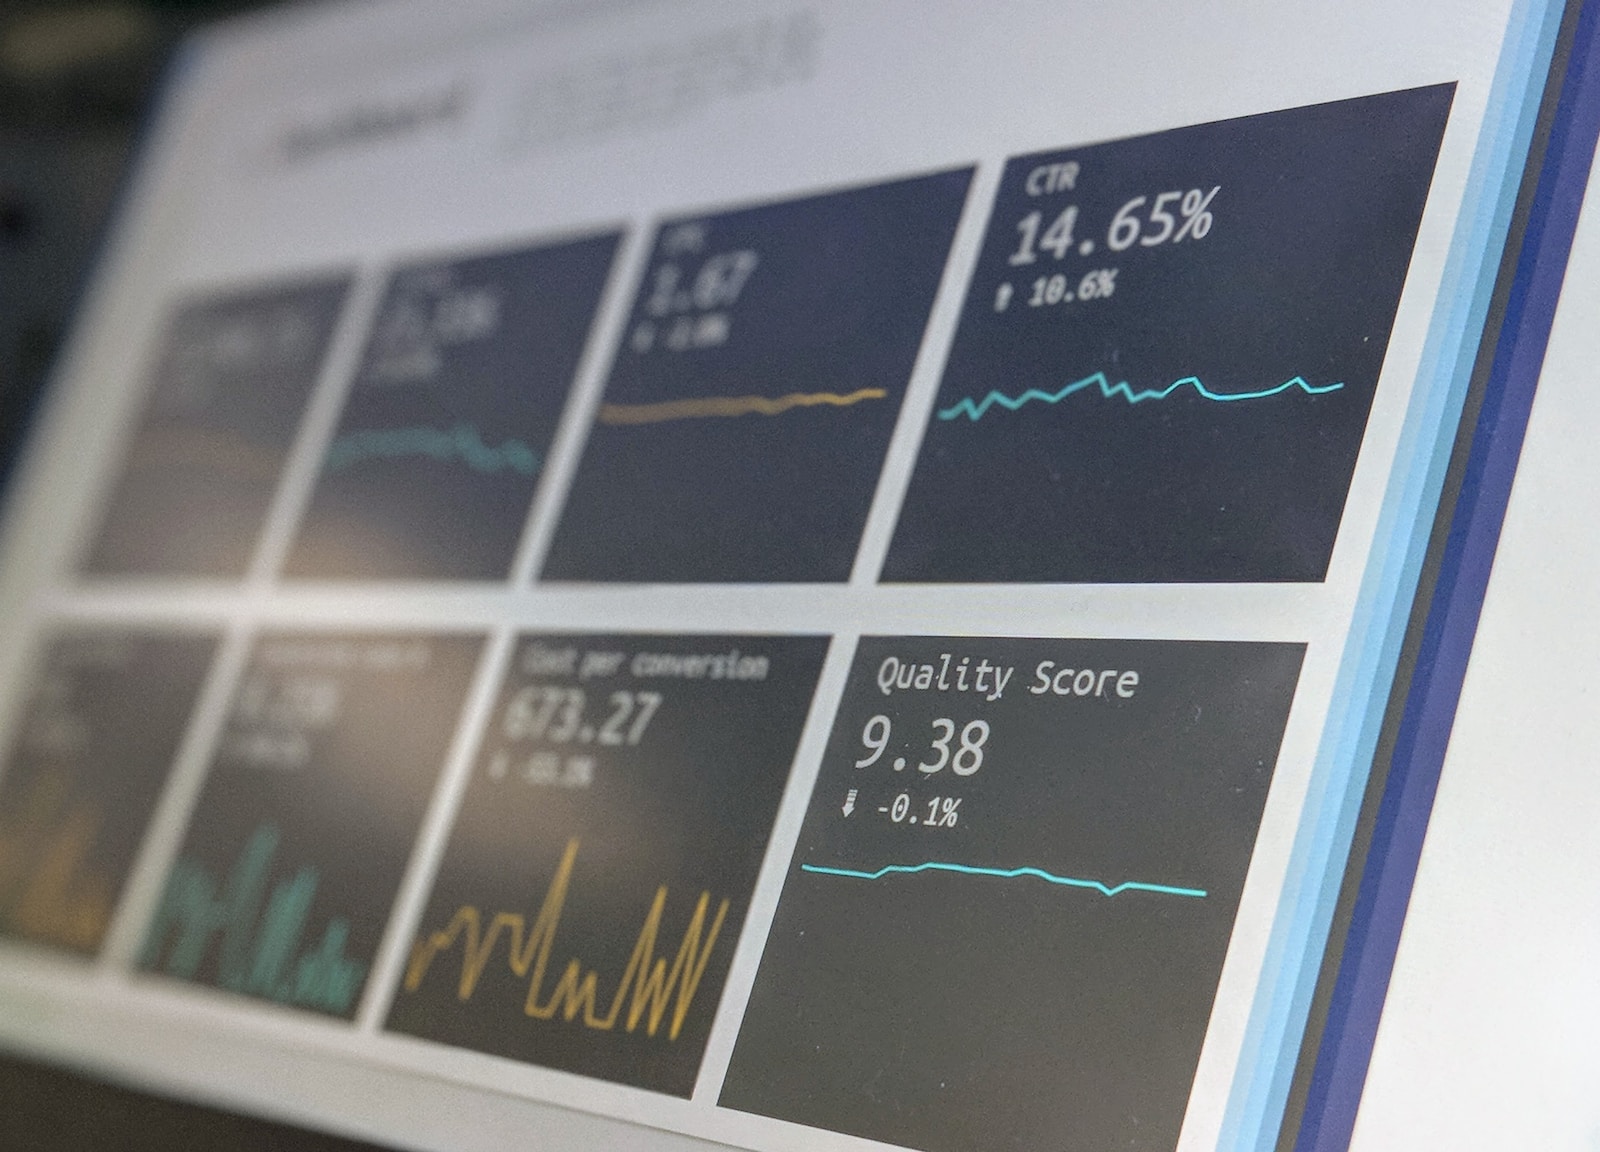
Customizable dashboards empower you to present data in a way that speaks directly to key stakeholders. Whether it’s eye-catching pie charts or comprehensive line graphs, distill complex data into convincing visuals that pave the way for strategic decisions.
| Reporting Tool | Top Features | User Rating |
|---|---|---|
| Salesforce Reports | Custom dashboards, Real-time analytics | 4.5/5 |
| Power BI | Data visualization, AI insights | 4.6/5 |
| Zoho Analytics | Forecasting, Data blending | 4.3/5 |
Enhance Collaboration with Seamless Integration
1. Building Bridges, Not Walls
Teamwork makes the dream work, and with tools like Slack integrations, your sales data can flow freely across departments breaking down silos and fostering a culture of unity and collaboration.
2. The Backbone of a Data-Driven Culture
To instill a data-centric approach throughout your organization, you need tools that integrate seamlessly into your existing workflows. Think of Tableau as the spinal cord that connects all the sensory data across your organization’s body.
3. Centralizing Data for The Ultimate Command Center
One source of truth is the command center of your sales strategy. Rather than scatter your data across multiple platforms, solutions like HubSpot’s Sales Dashboard centralize everything, giving you a panoramic view of your business landscape.
Transform Data into Revenue with Smart Reporting
The endgame of all this number-crunching? Driving revenue northward. Here’s how:
1. From Numbers to Narratives
Don’t just deliver reports; tell a story. By weaving data into compelling narratives, tools like Google Analytics help you present a persuasive tale that aligns with your company’s goals. Visit Google Analytics for more narrative-constructing features.
2. It’s All in the Follow-up
Aggressive follow-up strategies, informed by actionable insights from tools like Pipedrive, ensure that no lead is left unturned. Empower your team with knowledge of when to strike and when to nurture.
3. Zoom In on Efficiency
Efficiency is the name of the game. With CRM platforms such as Salesforce, streamline your processes and ensure your sales force is operating at peak efficiency, thereby ramping up your ROI.
- Identify bottlenecks quickly and accurately.
- Boost productivity with automated report generation.
- Create a winning strategy based on data, not guesswork.
Metrics That Matter
Key metrics such as customer acquisition cost (CAC), lifetime value (LTV), and churn rate are vital signs of your business’s health. With the right tools, track these metrics over time to ensure your sales machine is not only running, but sprinting towards your financial goals.
Choosing the Right Reporting Tool for Your Team 🔍

1. Determine Your Data Destiny
Before taking the leap, consider your specific needs. Do you require advanced customization, or is simplicity your cup of tea? Your team’s size, industry, and objectives will greatly influence your tool choice.
2. Demo Days Ahead
Don’t shy away from taking a test drive. Most providers offer free trials or demos – use them to get a feel for the user experience and make an informed decision.
3. Compatibility and Integration
Consider how well the tool integrates with your existing technology stack. The goal is to enhance your current system, not overhaul it entirely. Look for tools that can connect with your CRM, email platforms, or any other software your team uses regularly.
4. Scalability Is Key
Think long term – as your business grows, so will your data needs. A tool that works for a small team might not cut it for a large enterprise. Choose a tool that offers scalability to avoid future headaches.
5. Support and Community
Examine the level of support offered by the tool’s provider. A robust knowledge base, active community forums, and responsive customer service can make a big difference, especially when you encounter issues or need advice on best practices.
6. Analytics and Reporting Features
Dive into the type of analytics and reporting features available. Are they comprehensive enough for your needs? Can you create custom reports? Determine if the tool gives you the insights you require to make data-driven decisions.
7. Price vs. Value
Finally, balance cost against the value provided. An expensive tool with features you won’t use is not a wise investment, whereas a cost-effective tool that meets your needs can provide great value. Remember, the cheapest option isn’t always the best in the long run.
Selecting the right reporting tool is a crucial step for teams aiming to leverage data analytics for business growth. By matching the tool’s capabilities with your team’s needs and ensuring it can scale and integrate smoothly with your systems, you’ll set yourself up for improved collaboration, more intelligent insights, and ultimately, increased revenue.


